Jones and Associates Realty, LLC Archived Blog

Blog

Displaying blog entries 1-10 of 55

Salt Lake County More Homes Available to Buyers

by Mark and Monte Jones

Great news for home buyers in Salt Lake.  Our market has a little more inventory to select from.  Just a few months ago we had less than a two months supply of active homes available.  Now we have just over four months! 

This will not only make it easier for home buyers to find the right home but then negotiate the right terms.    These new figures put us very close to what most Real Estate professionals consider a stable market. 

The higher inventory makes it more important home sellers select a real estate agent that makes their property stand out from competition   Call Mark or Monte today to see how we make our clients listings stand out from the competition! 

Want to know the absorption rate for your neighborhood or what your home is worth?  Call or email us today.


Cost of Buying a Home

by Mark and Monte Jones

Wow is now the time to buy a home?   The kcm blog this morning nails it!

The cost of a home is determined mainly by two components: price and mortgage rate. Today, we want to show how the monthly cost of purchasing a median priced home has changed over the last twelve months and how it might change over the next twelve months. For the first two examples, we will be using the National Association of Realtors’ (NAR) Existing Home Sales Report to establish median price and Freddie Mac’s Primary Mortgage Market Survey to establish mortgage rate. We also assumed a 20% down payment in all examples.

LAST YEAR

The median priced home in the country was selling for $187,800. The 30-year fixed mortgage rate was at 3.5%. Here is what it would cost to buy a home last year:

TODAY

The median priced home in the country is selling for $213,500. The 30-year fixed mortgage rate is at 4.5%. Here is what it would cost a purchaser to buy a home today:

The monthly cost increased by: $190.78!

NEXT YEAR

Projecting into the future in real estate can be rather tricky. To establish future pricing, we depended on the over 100 housing experts surveyed for the Home Price Expectation Survey who called for an approximate appreciation rate of 5% over the next twelve months. For the interest rate, we took the average of the projections from the Mortgage Bankers’ Association, Freddie Mac and Fannie Mae. Here is what these experts project will be the approximate cost of a home a year from now:

The monthly cost will increase by about: $97.32!

Bottom Line

From a financial perspective, why wait if you are thinking about buying?

Salt Lake County Real Estate

by Mark and Monte Jones

Salt Lake County Real Estate Market is smoking hot!  We thought we would share this chart with some interesting statistics about Salt Lake County's Estate market:


Month

Count

Volume

Mdn OL $

Mdn Sold $

Mdn S to OL

Mdn SQ FT

Mdn $/SQ FT

Mdn Beds

Mdn Baths

Mdn CDOM

Jul-06

1,644

$426,375,805

$220,000

$221,219

101%

2,024

$108

3

2

12

Aug-06

1,776

$471,924,407

$224,900

$222,000

99%

2,019

$109

3

2

12

Sep-06

1,570

$413,584,592

$224,900

$219,900

98%

2,000

$110

4

2

15

Oct-06

1,562

$414,654,408

$224,900

$218,000

97%

1,969

$112

3

2

17

Nov-06

1,440

$380,295,148

$224,900

$219,450

98%

1,998

$112

3

2

22

Dec-06

1,259

$341,638,564

$229,900

$224,000

97%

2,000

$113

3

2

29

Jan-07

1,147

$293,319,994

$224,900

$220,000

98%

1,968

$113

3

2

35

Feb-07

1,148

$308,293,434

$230,000

$225,747

98%

1,976

$114

3

2

30

Mar-07

1,528

$430,466,731

$238,950

$233,350

98%

1,991

$118

3

2

25

Apr-07

1,401

$376,654,793

$230,000

$229,000

100%

1,912

$120

3

2

19

May-07

1,588

$434,572,354

$239,000

$235,000

98%

1,965

$122

3

2

20

Jun-07

1,477

$431,560,347

$249,900

$242,000

97%

2,002

$124

3

2

21

Jul-07

1,285

$366,608,051

$239,900

$235,000

98%

1,914

$123

3

2

27

Aug-07

1,330

$384,929,108

$246,400

$238,000

97%

1,964

$123

3

2

32

Sep-07

907

$249,863,468

$239,900

$225,000

94%

1,905

$121

3

2

38

Oct-07

1,027

$279,480,071

$239,900

$230,000

96%

1,944

$119

3

2

45

Nov-07

920

$238,739,385

$237,200

$220,750

93%

1,912

$115

3

2

53

Dec-07

795

$212,270,734

$236,900

$220,000

93%

1,916

$117

3

2

63

Jan-08

642

$171,858,359

$254,995

$232,500

91%

2,061

$113

3

2

77

Feb-08

753

$201,822,291

$240,000

$223,000

93%

1,978

$116

3

2

89

Mar-08

952

$256,019,739

$239,900

$225,250

94%

1,996

$115

3

2

76

Apr-08

1,021

$276,794,993

$249,900

$234,000

94%

2,073

$114

4

2

70

May-08

1,085

$296,641,034

$245,000

$235,000

96%

2,022

$117

4

2

57

Jun-08

1,147

$316,995,034

$244,900

$229,900

94%

1,980

$119

4

2

59

Jul-08

1,042

$285,390,552

$246,000

$232,125

94%

2,032

$116

4

2

63

Aug-08

1,046

$282,077,884

$240,895

$225,320

94%

1,985

$117

3

2

61

Sep-08

1,056

$271,261,722

$230,000

$220,000

96%

1,963

$113

3

2

66

Oct-08

852

$225,773,661

$248,450

$225,150

91%

2,097

$111

4

2

71

Nov-08

597

$156,016,444

$249,000

$228,600

92%

2,120

$104

4

2

77

Dec-08

719

$186,356,700

$245,000

$224,900

92%

2,160

$103

4

2

79

Jan-09

444

$120,011,322

$255,275

$230,500

90%

2,202

$102

4

3

96

Feb-09

600

$158,387,599

$249,900

$222,500

89%

2,105

$102

4

3

107

Mar-09

741

$190,646,553

$244,900

$220,000

90%

2,213

$100

4

2

110

Apr-09

867

$218,439,483

$245,300

$220,000

90%

2,160

$99

4

2

95

May-09

1,015

$266,518,541

$249,900

$225,000

90%

2,180

$101

4

2

81

Jun-09

1,232

$320,869,263

$240,000

$220,000

92%

2,118

$102

4

2

71

Jul-09

1,114

$288,178,093

$239,900

$220,450

92%

2,172

$99

4

2

71

Aug-09

1,037

$265,668,000

$239,000

$219,000

92%

2,164

$102

4

2

64

Sep-09

969

$231,038,040

$219,900

$206,000

94%

1,996

$104

3

2

71

Oct-09

1,093

$260,893,389

$224,900

$206,000

92%

2,072

$101

3

2

63

Nov-09

1,120

$260,842,075

$219,900

$202,350

92%

2,028

$100

3

2

63

Dec-09

887

$220,471,012

$229,000

$212,857

93%

2,238

$93

4

2

60

Jan-10

525

$140,479,058

$235,000

$214,000

91%

2,240

$97

4

2

70

Feb-10

653

$159,174,819

$229,000

$209,000

91%

2,120

$95

3

2

78

Mar-10

1,012

$234,799,845

$219,000

$200,000

91%

2,072

$96

4

2

80

Apr-10

1,174

$276,088,372

$218,850

$201,000

92%

2,100

$95

4

2

56

May-10

1,265

$295,173,560

$214,900

$200,000

93%

2,068

$96

4

2

55

Jun-10

1,077

$277,735,805

$237,000

$220,000

93%

2,313

$95

4

3

64

Jul-10

746

$194,595,808

$244,950

$228,250

93%

2,352

$93

4

3

60

Aug-10

780

$198,179,731

$239,900

$217,000

90%

2,309

$93

4

3

75

Sep-10

734

$190,048,629

$233,667

$213,900

92%

2,232

$93

4

2

82

Oct-10

738

$179,733,821

$229,000

$205,700

90%

2,195

$91

4

2

77

Nov-10

751

$182,077,302

$224,900

$200,000

89%

2,220

$88

4

2

89

Dec-10

834

$192,241,766

$224,900

$198,250

88%

2,238

$89

4

2

90

Jan-11

571

$134,786,056

$219,900

$196,000

89%

2,238

$87

4

3

97

Feb-11

646

$139,293,882

$214,900

$182,000

85%

2,195

$83

4

2

109

Mar-11

957

$208,788,724

$208,000

$185,500

89%

2,171

$85

4

2

104

Apr-11

942

$207,509,774

$208,940

$187,000

89%

2,168

$85

4

2

90

May-11

1,059

$235,037,003

$209,000

$189,000

90%

2,172

$84

4

2

69

Jun-11

1,090

$249,943,747

$214,975

$193,000

90%

2,204

$86

4

3

67

Jul-11

1,036

$231,674,145

$209,898

$189,700

90%

2,130

$87

4

2

66

Aug-11

1,119

$248,247,921

$199,900

$187,000

94%

2,187

$82

4

2

64

Sep-11

1,000

$223,702,654

$195,950

$178,250

91%

2,106

$84

4

2

71

Oct-11

1,035

$224,795,018

$199,000

$185,000

93%

2,132

$84

4

2

69

Nov-11

903

$196,951,358

$199,000

$180,000

90%

2,187

$82

4

2

66

Dec-11

923

$205,038,218

$199,000

$182,250

92%

2,190

$82

4

2

74

Jan-12

759

$156,957,739

$189,900

$174,000

92%

2,052

$82

3

2

79

Feb-12

850

$177,595,376

$186,750

$175,000

94%

2,119

$83

4

2

70

Mar-12

1,060

$232,879,735

$195,050

$180,000

92%

2,146

$83

4

2

56

Apr-12

1,129

$252,841,992

$204,900

$195,000

95%

2,112

$88

4

2

52

May-12

1,262

$293,474,932

$205,025

$200,000

98%

2,112

$90

4

2

36

Jun-12

1,252

$294,750,147

$205,000

$199,000

97%

2,134

$90

4

2

33

Jul-12

1,238

$283,814,257

$201,500

$195,000

97%

2,118

$91

4

2

28

Aug-12

1,380

$333,799,566

$214,900

$208,500

97%

2,179

$93

4

2

34

Sep-12

1,104

$261,582,503

$207,725

$199,000

96%

2,118

$92

4

2

31

Oct-12

1,218

$285,881,350

$214,900

$205,500

96%

2,121

$93

4

2

34

Nov-12

1,092

$259,314,927

$210,160

$206,875

98%

2,110

$94

4

2

34

Dec-12

982

$240,069,600

$219,900

$205,000

93%

2,185

$93

4

2

35

Jan-13

808

$187,142,164

$214,900

$207,750

97%

2,080

$93

4

2

41

Feb-13

846

$202,367,713

$219,900

$212,950

97%

2,134

$95

4

2

43

Mar-13

1,122

$272,628,715

$215,000

$210,000

98%

2,122

$98

4

2

32

Apr-13

1,323

$339,294,206

$225,000

$222,000

99%

2,080

$103

4

2

19

May-13

1,537

$418,514,108

$239,000

$231,500

97%

2,200

$104

4

3

16

Jun-13

1,506

$410,841,082

$239,900

$237,000

99%

2,160

$106

4

2

15

Jul-13

1,452

$386,133,472

$235,000

$229,900

98%

2,104

$108

4

2

18


If you want to know how much your home is worth call, text  or email the Jones team today Mark and Monte are ready to help with all your real estate needs!


Truilia's Blog: 5 Real Estate Recovery Myths

by Mark and Monte Jones

We wanted to share today's Trulia Blog on our site because we feel they are true and we have heard them with our buyers and sellers as well!

Like anything else, real estate has its urban legends, its stories that get told so often they seem like they must be true. But unlike urban legends about exploding Pop Rocks or the origins of Jennifer Aniston’s ‘Friends’-era haircut, real estate myths have the potential to create fear, panic, paralysis and all sorts of other decision glitches.

The recent market upturn, coming on the heels of 6 years of near-Depression, has given rise to its own set of real estate myths. Here is a handful, along with some ways you can and should rethink them.

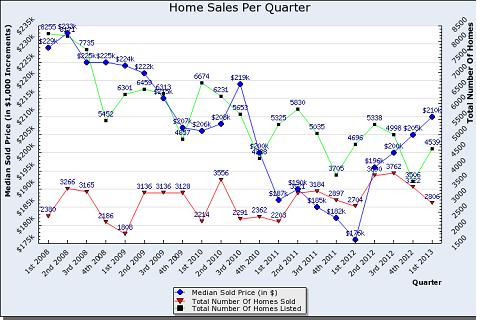
Myth #1. It’s recovering too fast. According to the Standard & Poor’s/Case-Shiller home-price index, American home prices increased an average of 10.6 percent between March 2012 and March 2013. Twelve of the 20 major metro areas tracked had year-over-year median home price increases in the double-digits. The list was topped by Phoenix, San Francisco and Las Vegas, all of which saw 20 percent or greater annual home price increases.

That seems crazy fast, to some. So crazy, in fact, that it’s created the fear that the current market’s exuberance will re-create the steep incline and decline in home values that we all remember not-so-fondly from the last boom-bust cycle.

Here’s the deal: markets have cycles, period. So I can guarantee you that the ups and downs will repeat, though hopefully not to such extremes. Part of what made the last down cycle so extreme was the fact that lenders were greenlighting massive home loans to borrowers without requiring them to document their ability to pay for the property over the long term. Buyers, in turn, overextended themselves regularly. Today’s loans are allowing people to buy without putting much down, but I haven’t seen almost any examples of the fully stated income or so-called “liar’s” loans that really got people in trouble. (Yet.)

Here’s the other thing: the data can be a bit misleading. When an area’s home values have been very, very depressed for long, it simply doesn’t take that vast of an uptick to generate double-digit percentage point increases. When you look at the top five recovery markets, according to the Case-Shiller, four of them: Phoenix, Las Vegas, Miami and Tampa – ranked among the hardest hit markets in the foreclosure crisis and resulting downturn. (San Francisco was the anomaly.) When you look at other markets that skated through the recession relatively unscathed, like New York, you see the percentage point increase year-over-year was much less impressive/ less scary (depending on your outlook), at 2.6 percent.

Myth #2. Investors are driving demand. In some areas, investors are buying up lots of low-priced homes. From big Wall Street investment groups to Mom-and-Pop investors, people who don’t plan to live in the homes they’re buying were responsible for about 20% of May home sales. But this number is actually on a downward path – investors were responsible for 22% of home sales in April, and investor activity should continue to decline as prices increase, putting a cap on the profits investors can realize.

While investor activity is declining, buyer demand is increasing, as evidenced by increasing numbers of cash transactions, offers per property and speed of homes leaving the market.

First-time buyers are responsible for 36% of current buyer activity and repeat homeowners for over 43%. Investors have been active, but by no means are they responsible for creating the intense buyer demand that now characterizes the market.

Myth #3. Sellers are stuck. This time, let’s start with what’s true. Many, many sellers in hot markets are in the midst of an exasperating Catch-22: they can finally sell their homes, which have been underwater for years. But now they struggle to buy, amidst the multiple offer mania – some report having to make offers on dozens of homes, or even having to rent a place until they can buy one.

As I see it, sellers aren’t stuck as much as they are being forced into being strategic about sequencing their transactions and setting up their deal points. During the recession, millions of sellers had no equity – or negative equity. That meant they couldn’t sell, which meant they didn’t have the money to buy – heck, many couldn’t even refinance. That’s what I call stuck. Now, they have the option to pull cash out to buy first, the option to refinance and stay put, and the option to sell – period. So for my dollar, today’s sellers are nowhere near stuck, compared with the truly stuck sellers of yesteryear.

Most of the sellers who have recently, truly gotten stuck (i.e., sellers who’ve been forced to rent until they could successfully buy) ended up in that situation because they listed their homes first, unaware that the market truly had shifted and that their home would fly off the market. Now, we know. So, if you’re selling in a super-hot market, work with your agent to put a strategy in place. Consider buying first, if you have the means or can get them. Or list your home with a Seller’s Contingency or a rent-back agreement (where your home’s buyer rents it back to you for a short time), to buy yourself some extra time to score a new place. Your agent and mortgage pros can help.

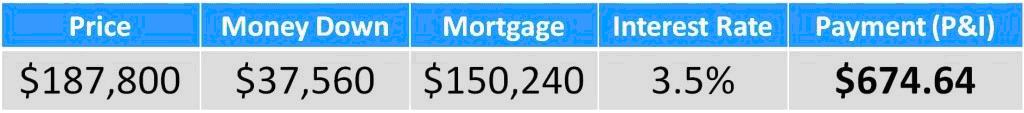
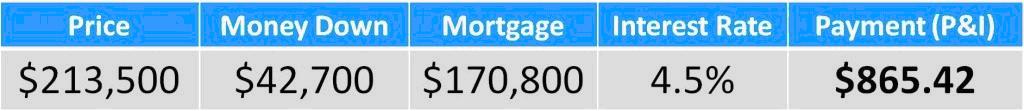
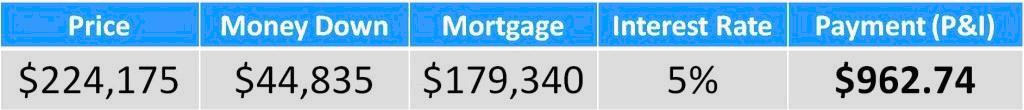
Myth #4. Rates are through the roof. Have mortgage interest rates gone up? Yes. Is the Fed signaling they intend to raise rates, too? Yes - in 2015. (Not exactly tomorrow.)

Last week’s reported 30 year mortgage rates were 3.94 percent, and 15-year rates were right around 3%. Given that the record low rates clocked in at 3.31 (30-year) and 2.62 (15-year), even today’s higher rates are not worth your worry. Nor is an increase of rates likely to cause all the pent-up buyer demand of the last few years to dissipate. My Dad used to remind me that people bought homes when rates were 14% in the 80’s, and they will buy them now, even as they inch up – because they need and want places to live.

Myth #5. Foreclosures are a thing of the past. Through the recession, many banks and mortgage servicers began to hold hundreds of thousands of foreclosed homes off the market to avoid flooding it, depressing prices even further than they already were. And even now, these institutions continue to trickle them onto the market, rather than creating a deluge of home inventory. Additionally, mortgage regulators now allow servicers to rent out REOs, versus selling them, and to hold them as long as 5 or 10 years following foreclosure, if needed.

While we are seeing a steep decline in the number of newly foreclosured homes, we can expect to have a higher-than-average number of foreclosed homes – REOs – on the market for some years to come. This so-called “shadow inventory” had declined over 10% nationwide between January 2012 and January 2013. And with the uptick in demand, we should continue to see this so-called “shadow inventory” of homes decline as banks take the opportunity to get these homes off their books.

Salt Lake County Home Median Price and How Much Waiting Can Cost You

by Mark and Monte Jones

In Salt Lake County the Median home price has risen from a low in the first quarter of 2012 of $176,000 to  $210,000 the first quarter of 2013!   How much has your dream home gone up over the last year?  Now compound that with interest rates going up…. 

This chart represents  the Median home prices for homes sold in Salt Lake county since 1st quarter of 2008 to fist quarter of 2013 along with total homes sold and listed in the same period.  If you want to know what your neighborhood is doing call, text or email us today!  We also wanted to share todays kcm blog with you since it goes along with the Salt Lake Median home data.

KCM posted this today and it makes perfect sense! 


Link to KCM's post:

Total Increase a Buyer May Pay if They Wait

Posted: 23 May 2013 04:00 AM PDT

Earlier in the Week, we explained that experts have projected that the U.S. home prices will appreciate by approximately 5% in 2013.  We also revealed the Mortgage Bankers Association, Fannie Mae and the National Association of Realtors have all projected that the 30 year mortgage rate will be at least 4% by the end of 2013.  If we assume that prices and interest rates will rise as projected, here is the monthly difference a buyer may pay if they wait a year. 

Salt Lake County Single Family Homes Absorption

by Mark and Monte Jones

We made it through the busiest time of the year!   For the buyer’s that have been looking, offering and been unsuccessful at getting a home under contract:  KEEP LOOKING AND HANG IN THERE!   A small window of opportunity is coming!

Every summer after the spring rush there is a short period of time between the end of June and end of July the real estate market slows down in Salt Lake.  I used to think this slow down was caused by Realtors taking time off to play in the sun.  I have discovered that is only part of the slow down the other part is buyers and sellers taking time off to play in the sun!    

If you are still shopping or on the fence, the summer slow down could be the perfect opportunity for you to find the perfect home!    

Buyer Tips for This Competitive Market like ours:

  • Make sure you have an aggressive agent that knows how to work a competitive market 
  • Make sure your agent makes you aware of new listings the day they hit the market   
  • Schedule to see new listings the day they hit the market
  • Have your ducks in a row, and make sure your agent and lender do as well
  • When you find the right home don’t delay on making an offer
  • Put your best foot forward when you offer remember when you get a home under contract you will think you offered too much and when you don’t get one you think you didn’t pay enough! 


You might have to make more than one offer before you get a home so don't get discouraged.  The following absorption report will explain why!   

 This absorption report is for single family homes sold or under contract in Salt Lake County.


2 Months

3 Months

4 Months

5 Months

6 Months

12 Months

Active Properties:

2,586

2,586

2,586

2,586

2,586

2,586

Under Contract Properties:

2,073

2,073

2,073

2,073

2,073

2,073

Sold Properties:

1,932

2,673

3,383

4,104

4,969

11,109

Market Absorption:

2,002.50 Per Month

1,582.00 Per Month

1,364.00 Per Month

1,235.40 Per Month

1,173.67 Per Month

1,098.50 Per Month

Inventory:

1.29 Months

1.63 Months

1.90 Months

2.09 Months

2.20 Months

2.35 Months

U.S. Home Sale Has $56,464 Impact on Economy

by Mark and Monte Jones

KCM nailed it again today!   Check out the impact a home sale has on our economy!

U.S. Home Sale Has $56,464 Impact on Economy

Posted: 09 May 2013 04:00 AM PDT

finbackRecently the research team at the National Association of Realtors (NAR) looked at studies done by the Bureau of Economic Analysis, the Census Bureau, Macroeconomic Advisors and the Joint Center for Housing Studies at Harvard. After reviewing the data, they determined the total economic impact of a typical home sale in the United States is an astonishing $56,464.

Here is the breakdown of their report:

Economic Contributions are derived from:

  • Home construction
  • Real estate brokerage
  • Mortgage lending
  • Title insurance
  • Rental and Leasing
  • Home appraisal
  • Moving truck service
  • Other related activities

When a House is Sold in the United States:

$14,958 – Income generated from real estate related industries

$5,647 – Additional expenditure on consumer items such as on furniture, appliances, and paint service

$3,509 – Expenditure on remodeling within 2 years of purchase

It generates an economic multiplier impact. There is a greater spending at restaurants, sports games, and charity events. The size of this “multiplier” effect is estimated to be: $11,575

Additional home sales induce additional home production. Typically one new home is constructed for every 8 existing home sales. Therefore, for each existing home sale, 1/8 of new home value is added to the economy which is estimated in the U.S. to be: $20,775

When you add the numbers up it comes to over $56,000!

How Much Over or Below List Price Should You Offer On a Home?

by Mark and Monte Jones

With a real estate market as hot as Salt Lake's right now it seems every buyer is asking one of these two questions:

How much under or over list price should I offer?

or

How much per square foot is are homes worth?

The answer is simple!   The true value of anything is what a willing buyer and a willing seller will agree upon.   The list price and the price per square foot have no bearing on the properties true value!

At Jones and Associates Realty we never tell you what to offer or what to list for but we do provide you all the data on homes similar to what you are looking at so you can determine how much the home is worth to you!   That is all that matters!  We can give you the latest data so you don't over pay or under sell.  Call text or email us today we are ready to help you!


Home Prices In Utah and How to offer!

by Mark and Monte Jones

We couldn’t agree more with today’s KCM blog!   Every home priced right seems to have multiple offers on it and this is in every price range!   Now we are starting to see appraisal problems because the true market value (what a buyer and seller agree upon) is higher than appraisers can find comparables for!   This means home prices are going up FAST along the Wasatch Front.   Call text or email Mark Jones or Monte Jones today to see what the absorption rate of homes in your area is.  Enjoy today’s KCM blog and feel free to call the Jones team with your real estate questions anytime.

KCM Blog dated 03-28-2013

Limited inventory and a very strong demand for housing has created an environment where bidding wars are commonplace in today’s real estate market. Homes priced properly are getting multiple offers within a short time of coming to market. This brings about a dilemma for the agent: How should they advise their client who is about to make an offer when other offers will also be presented?

Over the last several years, there wasn’t any pressure on the buyer to adjust their offer for three reasons:

  1. There were plenty of homes for sale
  2. Prices were falling
  3. Mortgage interest rates were falling

They buyer could find another home easily for probably less money and a lower mortgage rate. There was no downside to not ‘upping the ante’. However, in today’s market, things have dramatically changed.

HOUSING INVENTORY

A normal real estate market has between 5-6 months worth of inventory. Over the last several years, the inventory of homes for sale had skyrocketed to 10 months. Most buyers in almost any price range had a multitude of houses to choose from. Today, the national month’s supply of inventory has fallen below five months. In many markets, there is not enough housing inventory to satisfy the current demand.

Conclusion: If the buyer loses the house they are bidding on, there is no guarantee they will find a similar home anytime soon.

HOME PRICES

Becausemof the limited inventory, home prices are again appreciating. The Case Shiller Pricing Index revealed that house prices rose by 6.8% in 2012. Experts are projecting home prices to increase by 5% to 8% in 2013.

Conclusion: If the buyer doesn’t get this house, there is a good likelihood that a similar home will cost more in the future.

MORTGAGE RATES

The ‘cost’ of a home to a buyer is determined by the price of the house and the expense associated with the financing. Mortgage rates are projected to inch up in 2013. In a recent forecast, the Mortgage Bankers Association predicted that rates could climb as high as 4.3% by the end of the year.

Conclusion: If interest rates do inch up, the ‘cost’ of the next home could be impacted significantly.

Bottom Line 

If a buyer truly loves the house they are bidding on, it probably makes sense to raise their bid now instead of waiting for another dream house to appear.


Home prices in Salt Lake, Home prices Draper, Home Prices Riverton, Home Prices Bluffdale, Home prices South Jordan, Home prices West Valley, home prices West Jordan, Home prices along the Wasatch front are moving UP!

Home Prices in Salt Lake up 20% Compared to Last Year!

by Mark and Monte Jones

Seems so refreshing the bad news about the Salt Lake Real Estate Market is the available inventory!     We wanted to share this months market update sent from Curtis Bullock the CEO of teh Salt Lake Board:

The number of home sales in January reached 782, up only 1 percent compared to 774 home sales in January 2012. Pending home sales (purchase contract signed) were up 8 percent in January compared to a year ago (1,002 vs. 925). Inventory levels in Salt Lake County in January fell to 4,002 listings, down 29 percent compared to 5,664 listings a year ago. With active listings at a 15-year low, the home buying process has become fast-paced and competitive, major reasons for slowing homes sales in the month of January.

Slowing home sales are a result of limited inventory. However, home sales continue to be higher compared to last year at this time. Sales of condominiums, townhouses, and twin homes should accelerate as buyers seek alternatives to purchasing a single-family home.

The median home sales price in January climbed to $206,000, up 20 percent compared to a median price of $171,500 a year earlier. Based on sales trends in Salt Lake County over the past year, there was a 3.5-month supply of housing inventory in January, down from a 5.8-month supply in January 2012. A seller’s market is typically characterized by housing inventory levels below a four-month supply.

Neighboring Davis County saw a huge jump in home sales in January, with 243 closings, up 36 percent compared to 179 closings a year ago. The median home price in Davis County climbed to $195,450, up 6 percent compared to a median price of $185,124 in January 2012. Inventory levels in Davis County fell to 4.1 months, down from 6.8 months a year earlier.

You can view the full monthly summary reports at www.slrealtors.com under the "News" link.


Sincerely,


Curtis Bullock | CEO
The Salt Lake Board of Realtors

Displaying blog entries 1-10 of 55

Contact Information

Mark and Monte Jones
Jones And Associates Realty LLC
7069 Highland Dr. Suite 250
Cottonwood Heights UT 84121
801-635-4663
801-209-6906
Fax: 866-729-0308