Jones and Associates Realty, LLC Archived Blog

Blog

Displaying blog entries 1-2 of 2

Cost of Buying a Home

by Mark and Monte Jones

Wow is now the time to buy a home?   The kcm blog this morning nails it!

The cost of a home is determined mainly by two components: price and mortgage rate. Today, we want to show how the monthly cost of purchasing a median priced home has changed over the last twelve months and how it might change over the next twelve months. For the first two examples, we will be using the National Association of Realtors’ (NAR) Existing Home Sales Report to establish median price and Freddie Mac’s Primary Mortgage Market Survey to establish mortgage rate. We also assumed a 20% down payment in all examples.
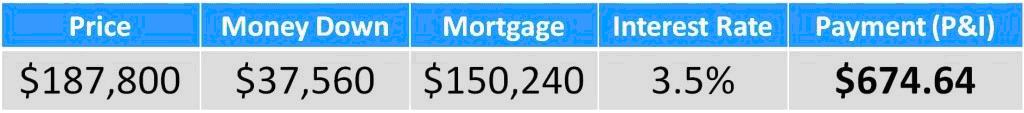
LAST YEAR

The median priced home in the country was selling for $187,800. The 30-year fixed mortgage rate was at 3.5%. Here is what it would cost to buy a home last year:

TODAY

The median priced home in the country is selling for $213,500. The 30-year fixed mortgage rate is at 4.5%. Here is what it would cost a purchaser to buy a home today:

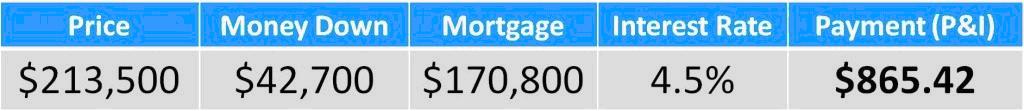
The monthly cost increased by: $190.78!

NEXT YEAR

Projecting into the future in real estate can be rather tricky. To establish future pricing, we depended on the over 100 housing experts surveyed for the Home Price Expectation Survey who called for an approximate appreciation rate of 5% over the next twelve months. For the interest rate, we took the average of the projections from the Mortgage Bankers’ Association, Freddie Mac and Fannie Mae. Here is what these experts project will be the approximate cost of a home a year from now:

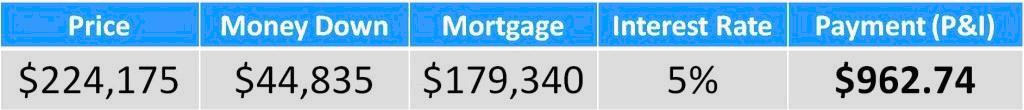
The monthly cost will increase by about: $97.32!

Bottom Line

From a financial perspective, why wait if you are thinking about buying?

Salt Lake County Real Estate

by Mark and Monte Jones

Salt Lake County Real Estate Market is smoking hot!  We thought we would share this chart with some interesting statistics about Salt Lake County's Estate market:


Month

Count

Volume

Mdn OL $

Mdn Sold $

Mdn S to OL

Mdn SQ FT

Mdn $/SQ FT

Mdn Beds

Mdn Baths

Mdn CDOM

Jul-06

1,644

$426,375,805

$220,000

$221,219

101%

2,024

$108

3

2

12

Aug-06

1,776

$471,924,407

$224,900

$222,000

99%

2,019

$109

3

2

12

Sep-06

1,570

$413,584,592

$224,900

$219,900

98%

2,000

$110

4

2

15

Oct-06

1,562

$414,654,408

$224,900

$218,000

97%

1,969

$112

3

2

17

Nov-06

1,440

$380,295,148

$224,900

$219,450

98%

1,998

$112

3

2

22

Dec-06

1,259

$341,638,564

$229,900

$224,000

97%

2,000

$113

3

2

29

Jan-07

1,147

$293,319,994

$224,900

$220,000

98%

1,968

$113

3

2

35

Feb-07

1,148

$308,293,434

$230,000

$225,747

98%

1,976

$114

3

2

30

Mar-07

1,528

$430,466,731

$238,950

$233,350

98%

1,991

$118

3

2

25

Apr-07

1,401

$376,654,793

$230,000

$229,000

100%

1,912

$120

3

2

19

May-07

1,588

$434,572,354

$239,000

$235,000

98%

1,965

$122

3

2

20

Jun-07

1,477

$431,560,347

$249,900

$242,000

97%

2,002

$124

3

2

21

Jul-07

1,285

$366,608,051

$239,900

$235,000

98%

1,914

$123

3

2

27

Aug-07

1,330

$384,929,108

$246,400

$238,000

97%

1,964

$123

3

2

32

Sep-07

907

$249,863,468

$239,900

$225,000

94%

1,905

$121

3

2

38

Oct-07

1,027

$279,480,071

$239,900

$230,000

96%

1,944

$119

3

2

45

Nov-07

920

$238,739,385

$237,200

$220,750

93%

1,912

$115

3

2

53

Dec-07

795

$212,270,734

$236,900

$220,000

93%

1,916

$117

3

2

63

Jan-08

642

$171,858,359

$254,995

$232,500

91%

2,061

$113

3

2

77

Feb-08

753

$201,822,291

$240,000

$223,000

93%

1,978

$116

3

2

89

Mar-08

952

$256,019,739

$239,900

$225,250

94%

1,996

$115

3

2

76

Apr-08

1,021

$276,794,993

$249,900

$234,000

94%

2,073

$114

4

2

70

May-08

1,085

$296,641,034

$245,000

$235,000

96%

2,022

$117

4

2

57

Jun-08

1,147

$316,995,034

$244,900

$229,900

94%

1,980

$119

4

2

59

Jul-08

1,042

$285,390,552

$246,000

$232,125

94%

2,032

$116

4

2

63

Aug-08

1,046

$282,077,884

$240,895

$225,320

94%

1,985

$117

3

2

61

Sep-08

1,056

$271,261,722

$230,000

$220,000

96%

1,963

$113

3

2

66

Oct-08

852

$225,773,661

$248,450

$225,150

91%

2,097

$111

4

2

71

Nov-08

597

$156,016,444

$249,000

$228,600

92%

2,120

$104

4

2

77

Dec-08

719

$186,356,700

$245,000

$224,900

92%

2,160

$103

4

2

79

Jan-09

444

$120,011,322

$255,275

$230,500

90%

2,202

$102

4

3

96

Feb-09

600

$158,387,599

$249,900

$222,500

89%

2,105

$102

4

3

107

Mar-09

741

$190,646,553

$244,900

$220,000

90%

2,213

$100

4

2

110

Apr-09

867

$218,439,483

$245,300

$220,000

90%

2,160

$99

4

2

95

May-09

1,015

$266,518,541

$249,900

$225,000

90%

2,180

$101

4

2

81

Jun-09

1,232

$320,869,263

$240,000

$220,000

92%

2,118

$102

4

2

71

Jul-09

1,114

$288,178,093

$239,900

$220,450

92%

2,172

$99

4

2

71

Aug-09

1,037

$265,668,000

$239,000

$219,000

92%

2,164

$102

4

2

64

Sep-09

969

$231,038,040

$219,900

$206,000

94%

1,996

$104

3

2

71

Oct-09

1,093

$260,893,389

$224,900

$206,000

92%

2,072

$101

3

2

63

Nov-09

1,120

$260,842,075

$219,900

$202,350

92%

2,028

$100

3

2

63

Dec-09

887

$220,471,012

$229,000

$212,857

93%

2,238

$93

4

2

60

Jan-10

525

$140,479,058

$235,000

$214,000

91%

2,240

$97

4

2

70

Feb-10

653

$159,174,819

$229,000

$209,000

91%

2,120

$95

3

2

78

Mar-10

1,012

$234,799,845

$219,000

$200,000

91%

2,072

$96

4

2

80

Apr-10

1,174

$276,088,372

$218,850

$201,000

92%

2,100

$95

4

2

56

May-10

1,265

$295,173,560

$214,900

$200,000

93%

2,068

$96

4

2

55

Jun-10

1,077

$277,735,805

$237,000

$220,000

93%

2,313

$95

4

3

64

Jul-10

746

$194,595,808

$244,950

$228,250

93%

2,352

$93

4

3

60

Aug-10

780

$198,179,731

$239,900

$217,000

90%

2,309

$93

4

3

75

Sep-10

734

$190,048,629

$233,667

$213,900

92%

2,232

$93

4

2

82

Oct-10

738

$179,733,821

$229,000

$205,700

90%

2,195

$91

4

2

77

Nov-10

751

$182,077,302

$224,900

$200,000

89%

2,220

$88

4

2

89

Dec-10

834

$192,241,766

$224,900

$198,250

88%

2,238

$89

4

2

90

Jan-11

571

$134,786,056

$219,900

$196,000

89%

2,238

$87

4

3

97

Feb-11

646

$139,293,882

$214,900

$182,000

85%

2,195

$83

4

2

109

Mar-11

957

$208,788,724

$208,000

$185,500

89%

2,171

$85

4

2

104

Apr-11

942

$207,509,774

$208,940

$187,000

89%

2,168

$85

4

2

90

May-11

1,059

$235,037,003

$209,000

$189,000

90%

2,172

$84

4

2

69

Jun-11

1,090

$249,943,747

$214,975

$193,000

90%

2,204

$86

4

3

67

Jul-11

1,036

$231,674,145

$209,898

$189,700

90%

2,130

$87

4

2

66

Aug-11

1,119

$248,247,921

$199,900

$187,000

94%

2,187

$82

4

2

64

Sep-11

1,000

$223,702,654

$195,950

$178,250

91%

2,106

$84

4

2

71

Oct-11

1,035

$224,795,018

$199,000

$185,000

93%

2,132

$84

4

2

69

Nov-11

903

$196,951,358

$199,000

$180,000

90%

2,187

$82

4

2

66

Dec-11

923

$205,038,218

$199,000

$182,250

92%

2,190

$82

4

2

74

Jan-12

759

$156,957,739

$189,900

$174,000

92%

2,052

$82

3

2

79

Feb-12

850

$177,595,376

$186,750

$175,000

94%

2,119

$83

4

2

70

Mar-12

1,060

$232,879,735

$195,050

$180,000

92%

2,146

$83

4

2

56

Apr-12

1,129

$252,841,992

$204,900

$195,000

95%

2,112

$88

4

2

52

May-12

1,262

$293,474,932

$205,025

$200,000

98%

2,112

$90

4

2

36

Jun-12

1,252

$294,750,147

$205,000

$199,000

97%

2,134

$90

4

2

33

Jul-12

1,238

$283,814,257

$201,500

$195,000

97%

2,118

$91

4

2

28

Aug-12

1,380

$333,799,566

$214,900

$208,500

97%

2,179

$93

4

2

34

Sep-12

1,104

$261,582,503

$207,725

$199,000

96%

2,118

$92

4

2

31

Oct-12

1,218

$285,881,350

$214,900

$205,500

96%

2,121

$93

4

2

34

Nov-12

1,092

$259,314,927

$210,160

$206,875

98%

2,110

$94

4

2

34

Dec-12

982

$240,069,600

$219,900

$205,000

93%

2,185

$93

4

2

35

Jan-13

808

$187,142,164

$214,900

$207,750

97%

2,080

$93

4

2

41

Feb-13

846

$202,367,713

$219,900

$212,950

97%

2,134

$95

4

2

43

Mar-13

1,122

$272,628,715

$215,000

$210,000

98%

2,122

$98

4

2

32

Apr-13

1,323

$339,294,206

$225,000

$222,000

99%

2,080

$103

4

2

19

May-13

1,537

$418,514,108

$239,000

$231,500

97%

2,200

$104

4

3

16

Jun-13

1,506

$410,841,082

$239,900

$237,000

99%

2,160

$106

4

2

15

Jul-13

1,452

$386,133,472

$235,000

$229,900

98%

2,104

$108

4

2

18


If you want to know how much your home is worth call, text  or email the Jones team today Mark and Monte are ready to help with all your real estate needs!


Displaying blog entries 1-2 of 2

Contact Information

Mark and Monte Jones
Jones And Associates Realty LLC
7069 Highland Dr. Suite 250
Cottonwood Heights UT 84121
801-635-4663
801-209-6906
Fax: 866-729-0308