Salt Lake County Housing Market Continues to Heat Up
We made the following chart using the number of single family homes sold in Salt Lake County. It clearly shows Salt Lake County’s housing market has picked up and has been gaining momentum since July of last year.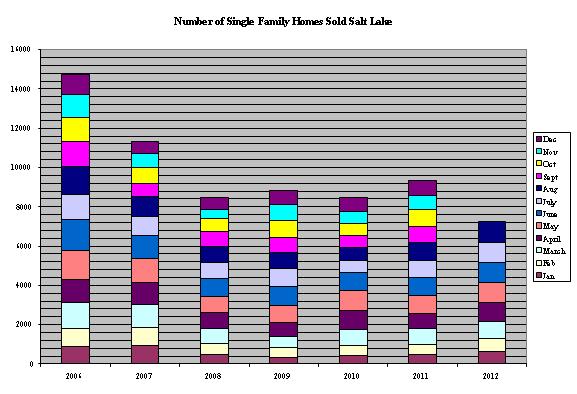
This chart is a the total number of single family homes sold in Salt Lake County from Jan-August 2006-2012.
|
Year |
2006 |
2007 |
2008 |
2009 |
2010 |
2011 |
2012 |
|
Homes sold Jan-Aug |
10,059 |
8,516 |
5,955 |
5,680 |
5,926 |
6,187 |
7,246 |
If you are considering buying your first home now is the time! If you are considering buying a bigger home now is the time! If you are considering buying an investment property now is the time! This next chart shows the cost per square foot for homes sold in Salt Lake County including Salt Lake City, Riverton, Herriman, South Jordan, Draper, West Valley, West Jordan, Taylorsville, Bluffdale, Holladay, Cottonwood Heights, Sandy, Alta, Midvale and South Jordan.
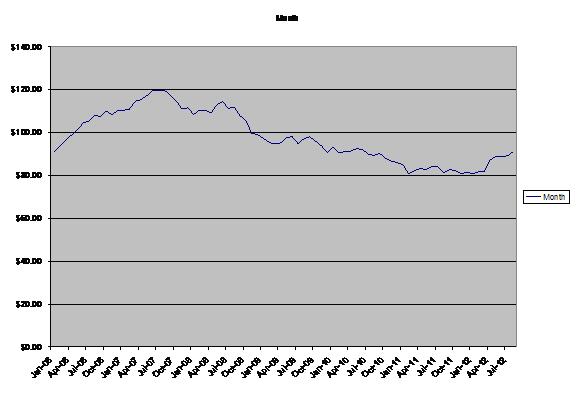 Yes that blue line represents the price per square foot of homes in Salt Lake County going form an all time high of $119.77 July 2007 to a low of $80.70 per square foot in February of 2011 to $91.28 a square foot in August of 2012.
Call the Mark Jones or Monte Jones today with any of your real estate questions.


