Mark Jones and Monte Jones Blog

Wasatch Front Real Estate Blog

Mark and Monte Jones

Blog

Displaying blog entries 21-30 of 55

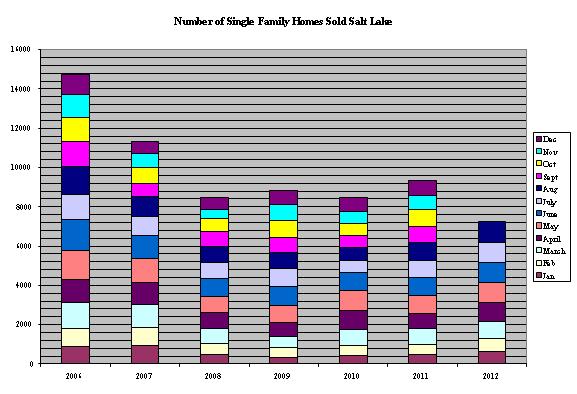
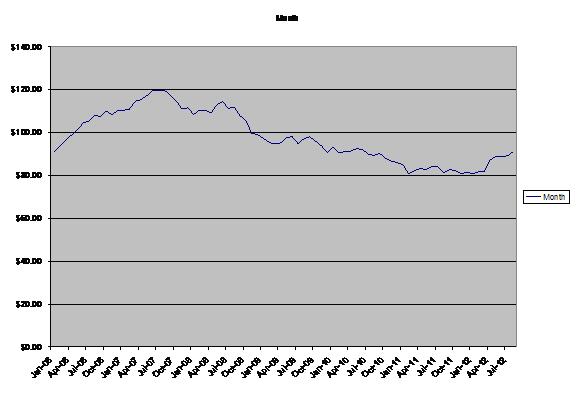
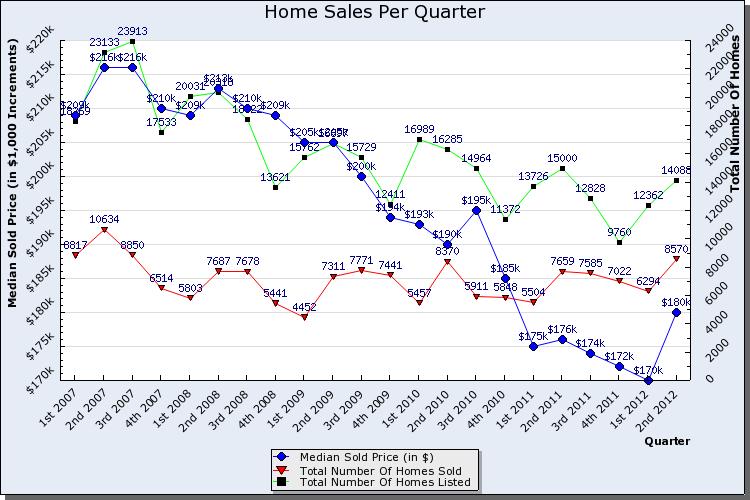
Salt Lake Housing Market Data

by Mark and Monte Jones

We truly believe now is a great time to buy a home.  Today KCM showed the chart below along with the headline:  

Is Real Estate better off then it was four years ago?

That depends on whether you are selling or buying...


Date

Median Sales price per NAR

30 Year mortgage rate per Freddie Mac Rate

Payment Principle and Interest Only

August

2008

$210,900

6.48%

$1,330.26

August

2012

$188,100

3.59%

$854.13

In our opinion the even bigger concern buyers should consider is were will the Salt Lake Housing market be in the next 6 months, year or five years….

No one knows what the future holds but if my son was 18 he would be buying a home today!    

The Jones team is happy to provide you free market data based upon your situation, price range, and area.   We will also tell you honestly if now is not the best time to jump into the market based upon the data.    

Call the Jones team today to see what your home is worth or what the blue line is doing in your price range and area of interest you may be surprised!

Salt Lake County Housing Market Continues to Heat Up

by Mark and Monte Jones

We made the following chart using the number of single family homes sold in Salt Lake County.  It clearly shows Salt Lake County’s housing market has picked up and has been gaining momentum since July of last year.

This chart is a the total number of single family homes sold in Salt Lake County from Jan-August 2006-2012.

Year

2006

2007

2008

2009

2010

2011

2012

Homes sold Jan-Aug

10,059

8,516

5,955

5,680

5,926

6,187

7,246

If you are considering buying your first home now is the time!  If you are considering buying a bigger home now is the time!  If you are considering buying an investment property now is the time!    This next chart shows the cost per square foot for homes sold in Salt Lake County including Salt Lake City, Riverton, Herriman, South Jordan, Draper, West Valley, West Jordan, Taylorsville, Bluffdale, Holladay, Cottonwood Heights, Sandy, Alta,  Midvale and South Jordan.

Yes that blue line represents the price per square foot of homes in Salt Lake County going form an all time high of $119.77 July 2007 to a low of $80.70 per square foot in February of 2011 to $91.28 a square foot in August of 2012. 

Call the Mark Jones or Monte Jones today with any of your real estate questions.


How Many Single Family Homes in Salt Lake County Available

by Mark and Monte Jones

Following are Absorption reports for homes in Salt Lake County.  The data is comprised of single family homes that are not short sales.  These reports clearly show why buyers in Salt Lake County are facing multiple offer situations and why prices are going up.   The low inventory levels make it crucial for a buyer to use a knowledgeable realtor to maximize the buyer’s chances of getting a home with multiple offers and seller's risk leaving money on the table unless they hire an agent that understands the market and were values are the day they list.    

When looking at the reports remember a healthy market has between 5 and 7 months of inventory available, a buyers market is over 7 months of inventory and a sellers market is under 5 months of inventory available.

If you want market data on your area please call, text or email the Jones Team anytime.

Homes under $100,000 that are not short sales Salt Lake County absorption rates:


2 Months

3 Months

4 Months

5 Months

6 Months

12 Months

Active Properties:

49

49

49

49

49

49

Under Contract Properties:

60

60

60

60

60

60

Sold Properties:

91

160

224

281

347

826

Market Absorption:

45.50 Per Month

53.33 Per Month

56.00 Per Month

56.20 Per Month

57.83 Per Month

68.83 Per Month

Inventory:

2.40 Months

2.04 Months

1.95 Months

1.94 Months

1.88 Months

1.58 Months


Homes from $100,000 to $200,000 that are not short sales Salt Lake County absorption rates:


2 Months

3 Months

4 Months

5 Months

6 Months

12 Months

Active Properties:

510

510

510

510

510

510

Under Contract Properties:

576

576

576

576

576

576

Sold Properties:

651

1,067

1,370

1,707

2,029

3,755

Market Absorption:

325.50 Per Month

355.67 Per Month

342.50 Per Month

341.40 Per Month

338.17 Per Month

312.92 Per Month

Inventory:

3.34 Months

3.05 Months

3.17 Months

3.18 Months

3.21 Months

3.47 Months


Homes from $200,000 to $300,000 that ar not short sales Salt Lake County Absorption rates:


2 Months

3 Months

4 Months

5 Months

6 Months

12 Months

Active Properties:

730

730

730

730

730

730

Under Contract Properties:

468

468

468

468

468

468

Sold Properties:

569

895

1,186

1,479

1,681

2,866

Market Absorption:

284.50 Per Month

298.33 Per Month

296.50 Per Month

295.80 Per Month

280.17 Per Month

238.83 Per Month

Inventory:

4.21 Months

4.02 Months

4.04 Months

4.05 Months

4.28 Months

5.02 Months

Homes from $300,000 to $400,000 that are not short sales Salt Lake County Absorption rates:


2 Months

3 Months

4 Months

5 Months

6 Months

12 Months

Active Properties:

501

501

501

501

501

501

Under Contract Properties:

229

229

229

229

229

229

Sold Properties:

228

389

506

609

694

1,154

Market Absorption:

114.00 Per Month

129.67 Per Month

126.50 Per Month

121.80 Per Month

115.67 Per Month

96.17 Per Month

Inventory:

6.40 Months

5.63 Months

5.77 Months

5.99 Months

6.31 Months

7.59 Months

Homes from $400,000 to $500,000 that are not short sales Salt Lake County Absorption rates:


2 Months

3 Months

4 Months

5 Months

6 Months

12 Months

Active Properties:

258

258

258

258

258

258

Under Contract Properties:

88

88

88

88

88

88

Sold Properties:

102

170

225

276

305

513

Market Absorption:

51.00 Per Month

56.67 Per Month

56.25 Per Month

55.20 Per Month

50.83 Per Month

42.75 Per Month

Inventory:

6.78 Months

6.11 Months

6.15 Months

6.27 Months

6.81 Months

8.09 Months


Homes from $500,000 to $600,000 that are not short sales Salt Lake County Absorption rates:


2 Months

3 Months

4 Months

5 Months

6 Months

12 Months

Active Properties:

129

129

129

129

129

129

Under Contract Properties:

45

45

45

45

45

45

Sold Properties:

54

85

106

124

140

242

Market Absorption:

27.00 Per Month

28.33 Per Month

26.50 Per Month

24.80 Per Month

23.33 Per Month

20.17 Per Month

Inventory:

6.44 Months

6.14 Months

6.57 Months

7.02 Months

7.46 Months

8.63 Months

Homes from $600,000 and Up that are not short sales in Salt Lake County Absorption rates:


2 Months

3 Months

4 Months

5 Months

6 Months

12 Months

Active Properties:

341

341

341

341

341

341

Under Contract Properties:

51

51

51

51

51

51

Sold Properties:

52

92

123

148

173

300

Market Absorption:

26.00 Per Month

30.67 Per Month

30.75 Per Month

29.60 Per Month

28.83 Per Month

25.00 Per Month

Inventory:

15.08 Months

12.78 Months

12.75 Months

13.24 Months

13.60 Months

15.68 Months


Are Short Sales in Salt Lake worth it?

by Mark and Monte Jones

The Jones team has helped many clients both buy and sell short sales. We know the different banks and how they work short sales, the different stages of the process and pros and cons of the process.

With so many short sales available we hear this question posed to us over and over again:   

Are Short Sales worth the hassle?

Our answer is YES!  

The fact is short sales don't have to be a hassle to a buyer or seller if the agent representing you understands them and explains the process!  To a seller they can be a blessing as most banks will allow the seller to short sale the property and agree to not go after a deficiency judgment.   Also most sellers get to stay in the house and not pay a mortgage payments while the short sale is being negotiated.  To the banks short sales are also a blessing as the bank is not responsible for maintaining and securing a vacant property.   To buyer's the third party or bank will typically take 88% of the appraised value.  Since most banks are slow at giving approvals the Appraised value could be from months ago and in a rebounding market like Salt Lakes this can be a huge savings to a buyers!

If you ever have a short sale question call, text or email Mark or Monte you might be surprised how simple they can be when you work with a professional that understands them!


Changes in USDA Rural Housing Boundaries

by Mark and Monte Jones

This is huge for our buyer's and seller's in the effected areas!  Please see this notice received from Josh Mettle at City Wide Home Loans and feel free to contact us with any questions or how this change will effect you!

There is a proposed change in eligible area boundaries that if approved, will go into effect October 1, 2012. The most likely areas that will be removed from eligibility are Eagle Mountain, Saratoga Springs, Tooele City, and Cedar City.

For those who are considering purchasing an existing home or building a home in one of these areas, please keep in mind the following items:

  • Should be under contract no later than 8/31/12 and in our office by 9/1/12.  The loan must be completely underwritten prior to submission to Rural Development.
  • The fully underwritten and approved loan package must reach USDA office no later than September 15th to be guaranteed that a conditional commitment will be issued prior to September 30th. (Loans may be submitted after this date but will be done on a first come, first serve basis.)
  • The USDA must  issue commitment prior to September 30th, 2012 and must close by 12/31/2012.

You do not need to close the loan prior to September 30th. The conditional commitment is good for 90 days. Conditional Commitments can be issued on appraisals that are subject to completion for new construction.

Please be aware that if the loan does not close within 90 days of issuing the conditional Commitment, USDA will not issue a loan note guarantee.

Also,  you should know about the revised the Up-Front Guarantee Fee and Annual Fee structure for Rural Development.

Changes to Guarantee and Annual Fee

Effective on October 1, 2012, the start of Fiscal Year (FY) 2013, Rural Development will revise the Up-Front Guarantee Fee and Annual Fee structure as follows:
Rural Development Revised Up-Front Guarantee Fee and Annual Fee Structure

The FY 2013 fee structure is applicable to all Conditional Commitments (Form RD 1980-18, “Conditional Commitment for Single Family Housing Loan Guarantee”) issued by Rural Development on or after October 1, 2012. 

The FY 2013 fee structure is only applicable to Conditional Commitments issued on or after October 1, 2012, Conditional Commitments issued by Rural Development prior to this date are not subject to the new fee structure.

If you have any questions about the new fees or deadlines, please give me a call at 801-747-1210.

The Economy's Impact on Housing

by Mark and Monte Jones

Want to share another great post by KCM.  The Wasatch Front real Estate Market is smoking hot and for sure helping to drive our economy.   I showed 23 homes this weekend from Salt Lake, Bluffdale, Draper,  Riverton, Herriman, Sandy, Cottonwood Heights,  West Jordan and West Valley over half the homes I saw were listed in the last 7 days and many of them had multiple buyers with their agents looking while we were there!   If you have been thinking about selling now is a great time to get your home on the market!  Call or email us today to find out what your home is worth you may be surprised!

The Economy’s Impact on Housing

With the economic recovery sluggish at best, many ask what impact this has on housing. Over the last several years, most economists believed that housing would not recover until the overall economy recovered. However, it now seems that the housing sector may be a driving influence in the recovery.

Here are four reports released in the last 30 days affirming this point:

Morgan Stanley

“In terms of its contribution to real GDP, residential fixed investment has been a positive – albeit modest – force over the most recent four quarters, marking its longest span of back-to-back positive results since 2005.”

Deutsche Bank

“The [overall] resumption in residential activity cannot be understated as the long awaited housing recovery should help buoy consumer confidence and provide a mild lift to second half economic output after what was likely a disappointing first half of the year.”

Fannie Mae

“The data from the past month collectively point to decelerating economic growth, but growth nonetheless…However, despite signs of deteriorating momentum for economic activity, housing continues to be a bright spot as news from the housing market has been relatively upbeat, presenting a rare upside boost to the economy.”

Goldman Sachs

“As we look back at previous major housing recoveries, 1975 and 1991 began with negative jobs growth…In each case, the home sales recovery was fueled by home price improvement, driving new job growth and those jobs creating a fresh wave of demand that supported a multi-year recovery in housing.”


Should You Buy a Home?

by Mark and Monte Jones

I was going to post a very positive article from the Wall Street Journal this morning titled: 

 Yes, The US Housing Bust is Over!  

This is a link to the article incase you want to read it:

online.wsj.com - The housing market has turned-at last. The U.S. finally has moved beyond attention-grabbing predictions from housing "experts" that housing is bottoming. The numbers are now convincing.

The key point in the article that caught my attention was:

"A new Wall Street Journal survey of forecasters found 44 believe the housing market has reached its bottom; only three don't. (The full results of the Journal's July survey will be released at 2pm ET)" 

It also read not only has the market bottomed, prices have started going up in many parts of the country.  We have witnessed Home Values increasing in almost all of Salt Lake, Davis and Utah counties this year.   If you are one our seller's now and experiencing appraisal problems you know this because yesterdays comps are not what todays buyers are willing to pay!    Our buyers also know this because they are seeing a very hot market with multiple offer notices and homes selling for more than list price! 

 Right when I was ready to hit post on the computer another article from KCM grabbed my attention.  It was titled:  Home Ownership the American Dream.   This is a link to it:

Homeownership: The American Dream

This article reminded me it doesn't matter if its a good or bad time to buy a home financially!  Unless your one of our investor client's it never has mattered.  The fact is:

 IT IS THE AMERICAN DREAM! 

I would argue it's almost every persons dream on earth to own a home in America!  It always has been and always will be the reason to own a home.  This was from the article:  "Fannie Mae’s quarterly National Home Survey, as far back as we can go, the top four reasons for buying a home are the same. The top four reasons people buy a home are:

  1. It means having a good place to raise children and provide them with a good education
  2. To have a physical structure where their family feels safe
  3. It allows for more space for their family
  4. It gives them control over what they do with their living space including renovations and updates."

So why are you waiting?  Call, text or email now to start your home search!


This is another positive article Utah ranks 2nd in 'Top States for Business' | ksl.com Link to article:


http://soc.li/qpkcRfZ
 

The Beehive State has taken a giant leap toward the nation's business elite, according to a CNBC report released Tuesday.posted by ksl from CNBC's Annual "Americas's Top States for Business" 

SALT LAKE CITY — The Beehive State has taken a giant leap toward the nation's business elite, according to a CNBC report released Tuesday.

Utah moved up six slots from eighth place last year to rank No. 2 in CNBC's annual "America's Top States for Business" study. Texas topped the list.

The 2012 study lauds Utah's strong workforce, effective transportation and low cost of doing business.

According to the survey, Utah ranked in the top 10 for cost of living, economy, infrastructure and transportation, workforce, quality of life and business friendliness. Additionally, the state was in the top 15 for cost of doing business and access to capital.

"This is no surprise to Utah, again confirming that reasonable regulation, low taxes and an unparalleled workforce are the best components to promote economic growth," Gov. Gary Herbert said. 

Top States for Business
Rank State
1. Texas
2. Utah
3. Virginia
4. North Carolina
5. North Dakota
6. Nebraska
7. South Dakota
8. Colorado
9. Georgia
10. Wyoming
 "We achieve this growth by creating the best conditions for the   free market  to do what it does best."

Utah ranked among the top 10 in six of 10 categories in the report, including workforce, qualify of life, infrastructure and transportation, economy, business friendliness and cost of living.

Despite all the positive attributes, Utah did suffer from one of the worst education rankings in the country, finishing 45th.

The report cited large class sizes, low spending and mediocre test scores as issues of concern.

Meanwhile, the state's low unemployment at 6 percent, low individual and corporate tax rates of 5 percent, along with a relatively low sales tax at 4.7 percent, were touted as additional attributes.

The announcement adds to Utah's list of recent accolades, including being Forbes' top state for business, the No. 1 state for economic outlook according to the American Legislative Exchange Council and the best-managed state according to The Pew Center on the States.

Rental Vacancies Fall - RENT IS GOING UP!

by Mark and Monte Jones

Yesterday the Wall Street Journal reported rental vacancies fell to 4.77%.  This is the lowest vacancy level since the end of 2001.  Rental vacancies rates were at 4.9% the first part of this year and up as high as 8% in 2009.   With the vacancy rate being so low it gives landlords the opportunity to push rents up.   This is a link to the entire article:

http://online.wsj.com/article/SB10001424052702303933404577505260835025948.html?mod=WSJ_qtoverview_wsjlatest

As the cost of rents rise owning a home becomes more and more attractive! 

Think about what your rent was 5 or 10 years ago...

Think about what your rent will be 5 or 10 years from now...   

Think about if you your rent was the same today as it was 5 or 10 years ago!

Guess what unless your landlord refinanced their payment stayed the same!

Stop making your landlord rich!  Call the Jones Team today to find your perfect home and lock your monthly payment in.

Absorption Report

by Mark and Monte Jones

Another Absorption report using just single family homes in Salt Lake County. When compared to the one we posted just a few weeks ago the available inventory continues to decrease!

SELLERS NOW IS THE TIME TO GET YOUR HOME ON THE MARKET!

BUYERS NOW IS THE TIME TO BUY! Before Appraisers catch up to what the market is doing. Call me today for a free market analysis on what your home is worth you might be surprised!


  2 Months 3 Months 4 Months 5 Months 6 Months 12 Months
Active Properties: 3,317 3,317 3,317 3,317 3,317 3,317
Under Contract Properties: 1,876 1,876 1,876 1,876 1,876 1,876
Sold Properties: 1,913 2,904 3,690 4,389 5,038 10,118
Market Absorption: 1,894.50 Per Month 1,593.33 Per Month 1,391.50 Per Month 1,253.00 Per Month 1,152.33 Per Month 999.50 Per Month
Inventory: 1.75 Months 2.08 Months 2.38 Months 2.65 Months 2.88 Months 3.32 Months


Displaying blog entries 21-30 of 55

Contact Information

Mark and Monte Jones
Jones And Associates Realty LLC
7069 Highland Dr. Suite 250
Cottonwood Heights UT 84121
801-635-4663
801-209-6906
Fax: 866-729-0308